 |
||
|
CAVE
Visualization of |
||
|
|
||
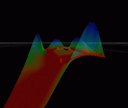
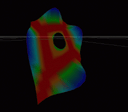
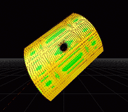
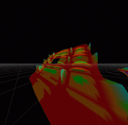
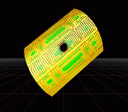
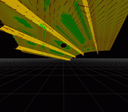
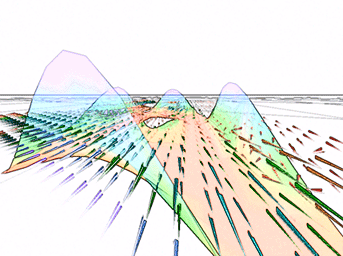
| This project is meant to interface a data set produced by researchers at the NASA Langley AFB with the virtual environment of the CAVE at EVL. The program is capable of visualizing various mechanical properties, such as: strain distributions, energy densities, etc, of an array of data points spread throughout the surface of a metal plate. An animation of the metal plate can be seen representing a series of time steps in which a load is applied over the data set. | ||
| The values of the data are displayed as variations in color and elevation on the plate. Blue representing the maximum stress, Yellow in the middle, and Red as the minimum value of the stress on the plate. | ||
|
|
Ultimately we would like to write VR tools the user could apply to the metal plate to analyze the mechanical properties and attain realtime feedback of the resulting affects from within the visualization. This would become part of a collaborative environment within the CAVE, allowing mutliple CAVE user's to work on the same set of data even though the CAVEs are physically separated by great distances. Possibly around the globe. | |
|
|
||
|
|
These
are some snapshots of the application; taken as seen from within the
CAVE: |
|
| back | ||
| home | ||
